Apertus On-Prem Deployment
What Apertus on-prem deployment includes
Discovery and inference install
We start with a working discovery — workload class, concurrency profile, latency budget, regulatory frame — and install the inference server in your estate. vLLM is the default for high-throughput Apertus on-prem deployment; TGI fits teams already on the Hugging Face surface. The install lands in your CI and image registry, not on a laptop.
GPU sizing to your prompt mix
Production sizing is never guessed from a model card. We benchmark Apertus 8B, and the 70B variant where the workload demands it, against your real prompt distribution and concurrency. Clusters land on H100, A100 or L40S class silicon; quantized variants extend the 8B class onto lighter hardware. Hardware is customer-procured or cloud only.
Monitoring wired into your stack
Apertus is wired into your existing Prometheus and Grafana, with alerting routed to your on-call system. We expose GPU utilisation, queue depth, prompt and completion lengths, request latency and error classes — the metrics your platform team already reads for every other service. No parallel observability silo.
Load testing to acceptance set
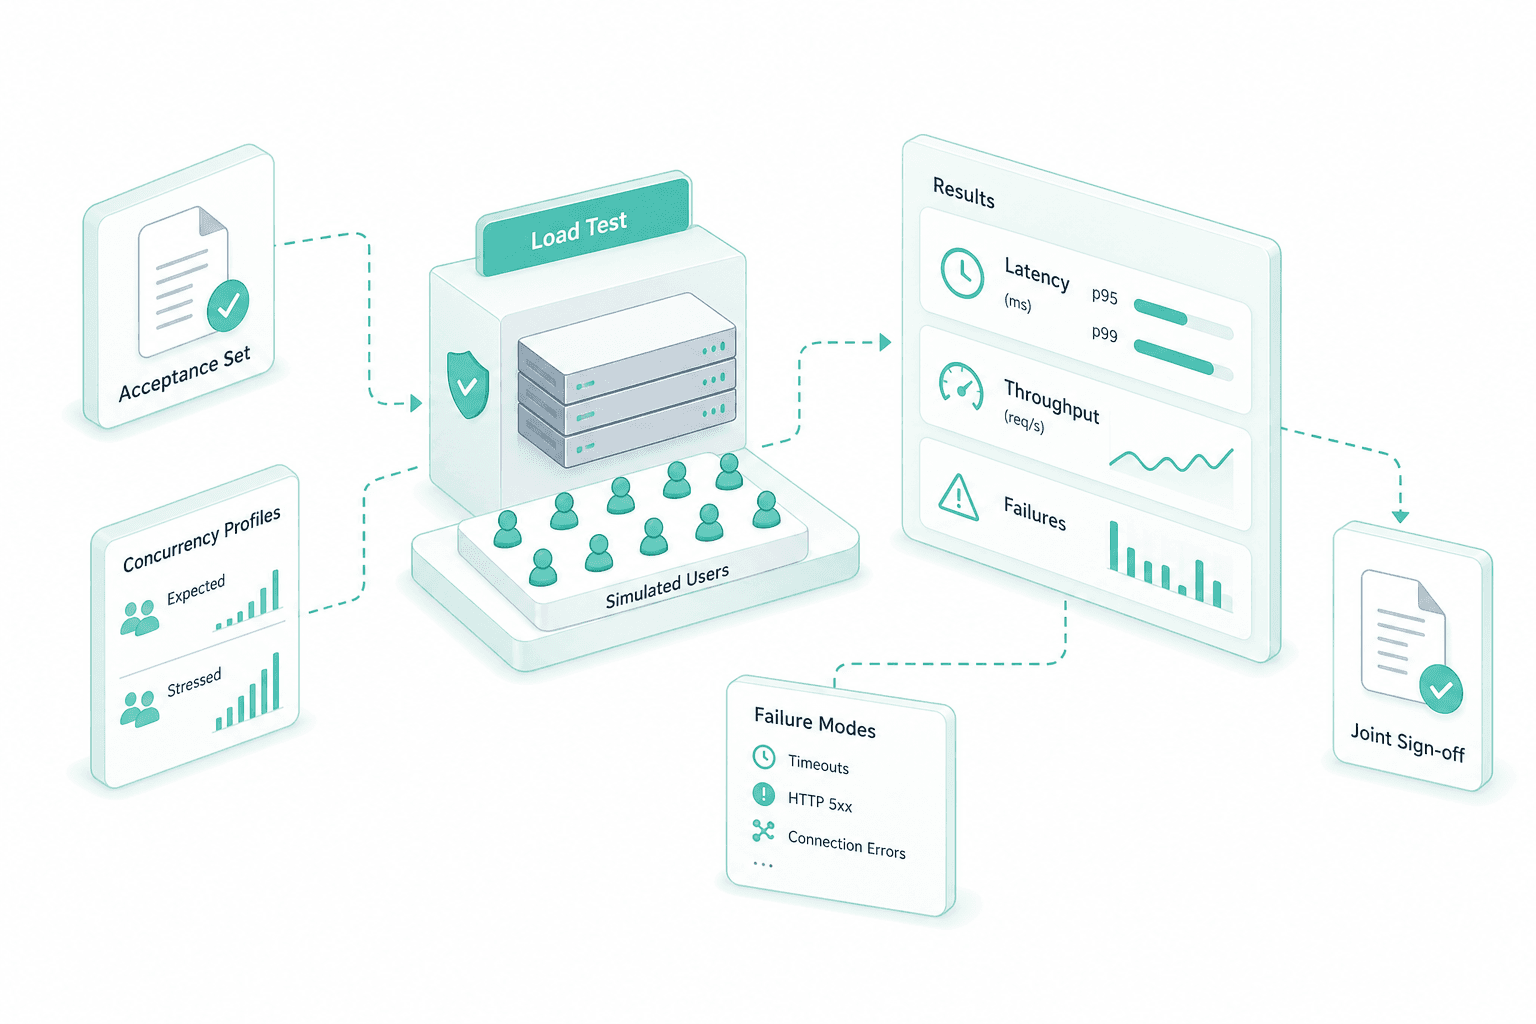
Before go-live the cluster is load-tested against a representative request mix and an acceptance set drawn from your real prompts. Sustained throughput, p95 and p99 latency, queue saturation and failure modes are measured under expected and stressed concurrency, then signed off jointly. Production starts on a benchmark, not on a hope.
Production SLA and on-call
The SLA is shaped to the workload class — interactive chat, batch enrichment or background RAG — and covers response targets, on-call coverage windows, incident classification and escalation paths. Targets sit on the latency budget the application can actually absorb, agreed in discovery rather than copied from a generic template.
Hand-off to your platform team
Knowledge transfer is part of the engagement, not a follow-on quote. Runbooks, scaling playbooks, capacity model, image-rebuild pipeline and incident procedures are written for your platform team and rehearsed with them. For the hosting alternative see Swiss data-sovereignty hosting.
How we deliver on-prem
Discovery and frame
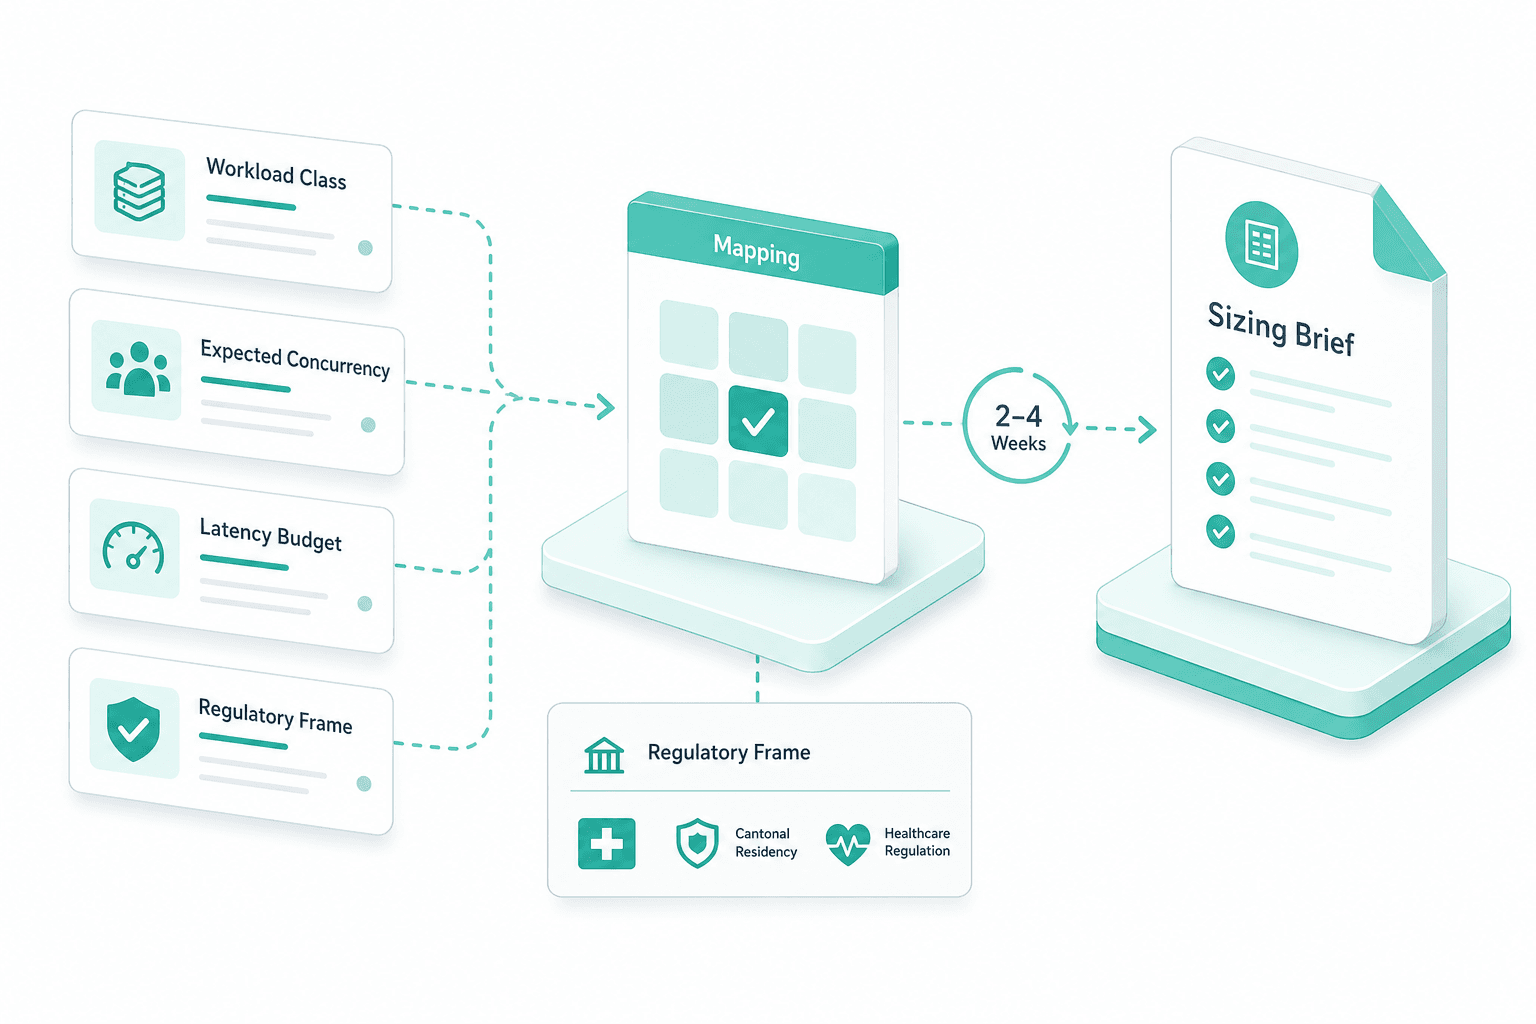
Workload class, expected concurrency, latency budget and regulatory frame — FINMA, cantonal residency, healthcare regulation — are mapped in two to four weeks. The output is the sizing brief that drives every later step.
GPU sizing and supply
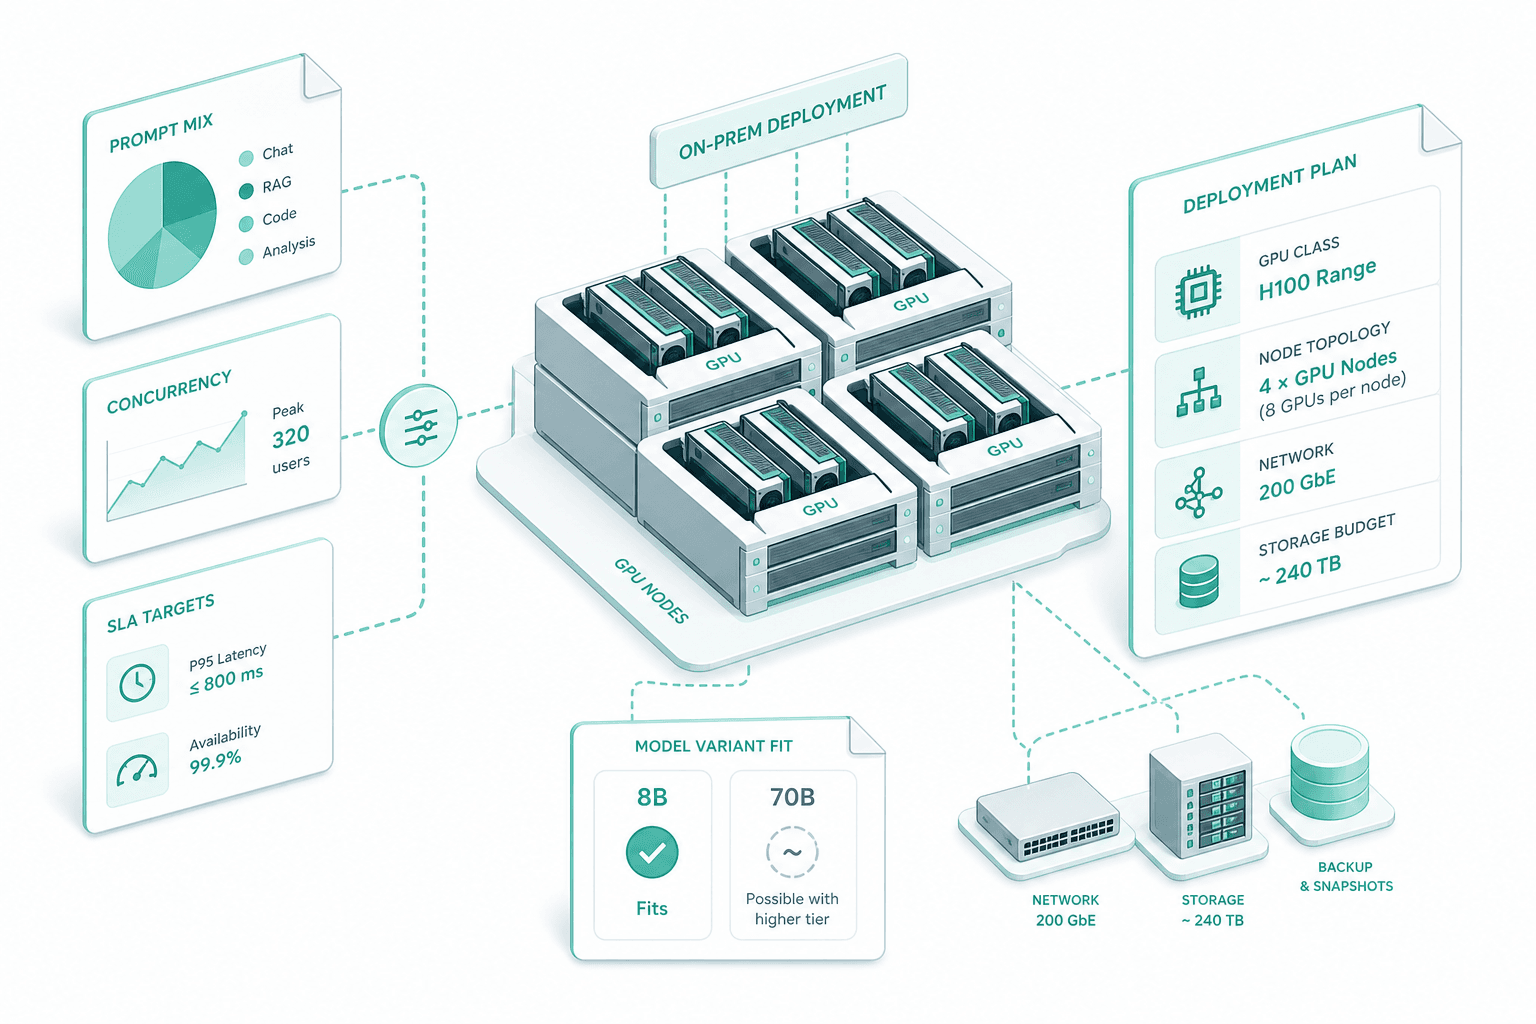
We size against your real prompt mix and concurrency, not a generic recipe. The plan names GPU class (H100, A100 or L40S range), node topology, network and storage budget, and whether the 8B or 70B variant fits.
Install and serving
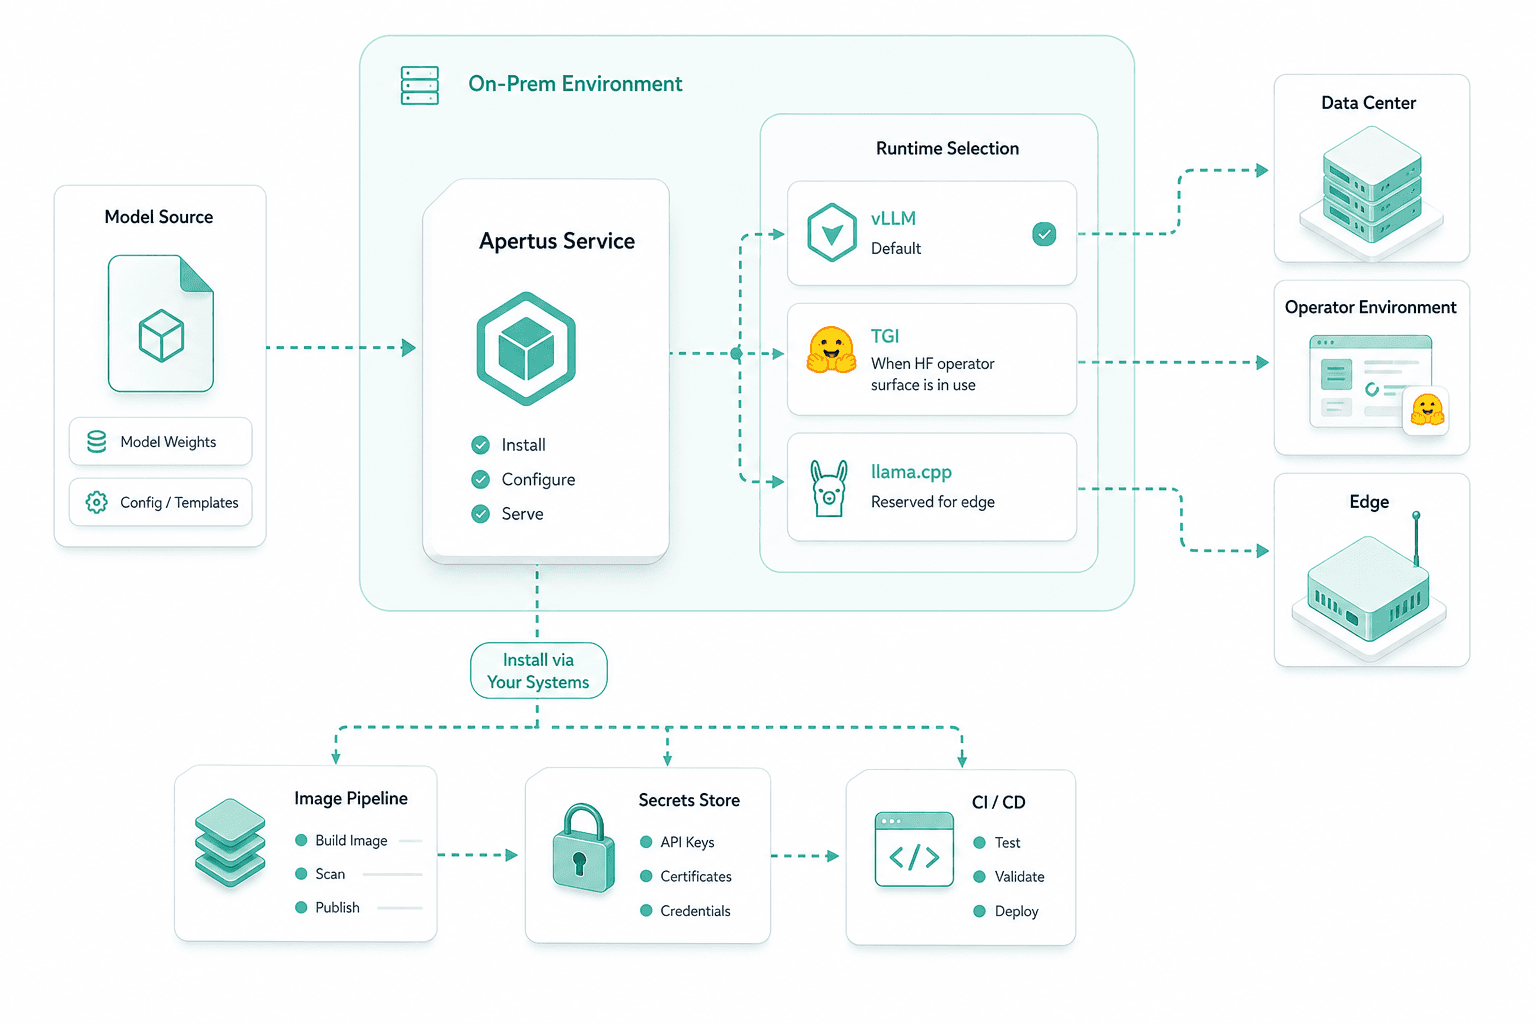
vLLM is the default; TGI is picked where the Hugging Face operator surface is already in use; llama.cpp is reserved for edge. The install runs through your image pipeline, your secrets store and your CI, like any other service.
Monitoring and alerting
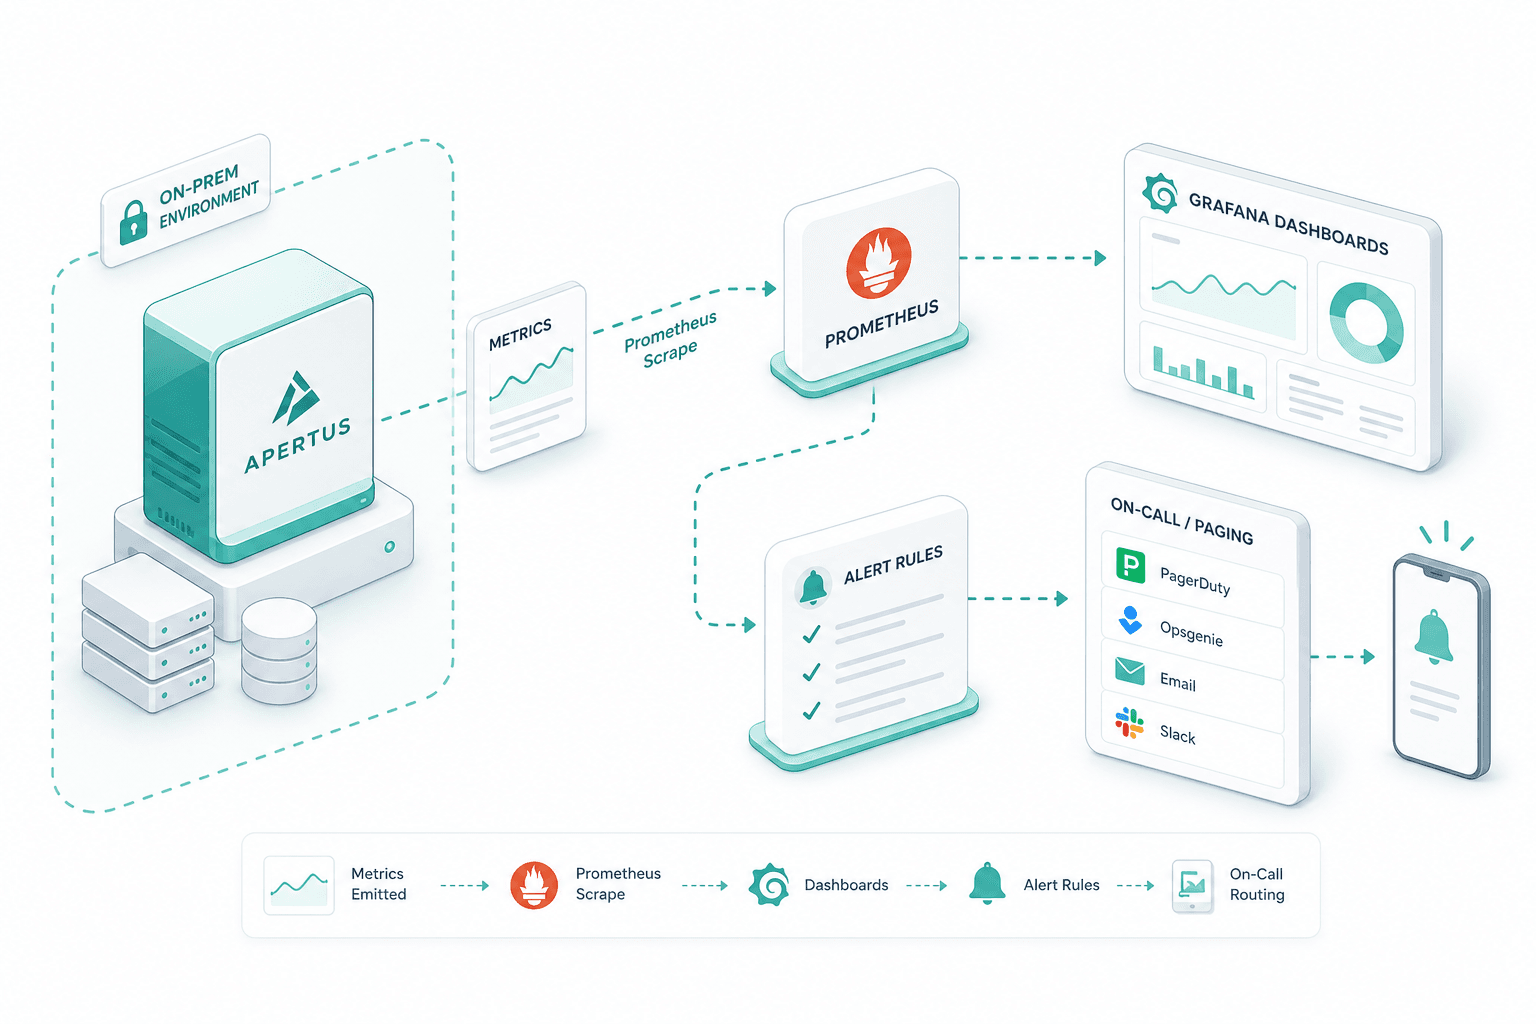
Apertus emits the metrics your stack already speaks. We wire Prometheus scraping, Grafana dashboards and alert rules into your existing observability, with on-call routing through whatever paging system you already use.
Load test and acceptance
We run a representative load test against your acceptance set under expected and stressed concurrency, capture p95 and p99 latency, sustained throughput and failure modes, and sign off jointly with your team.
Go-live and on-call
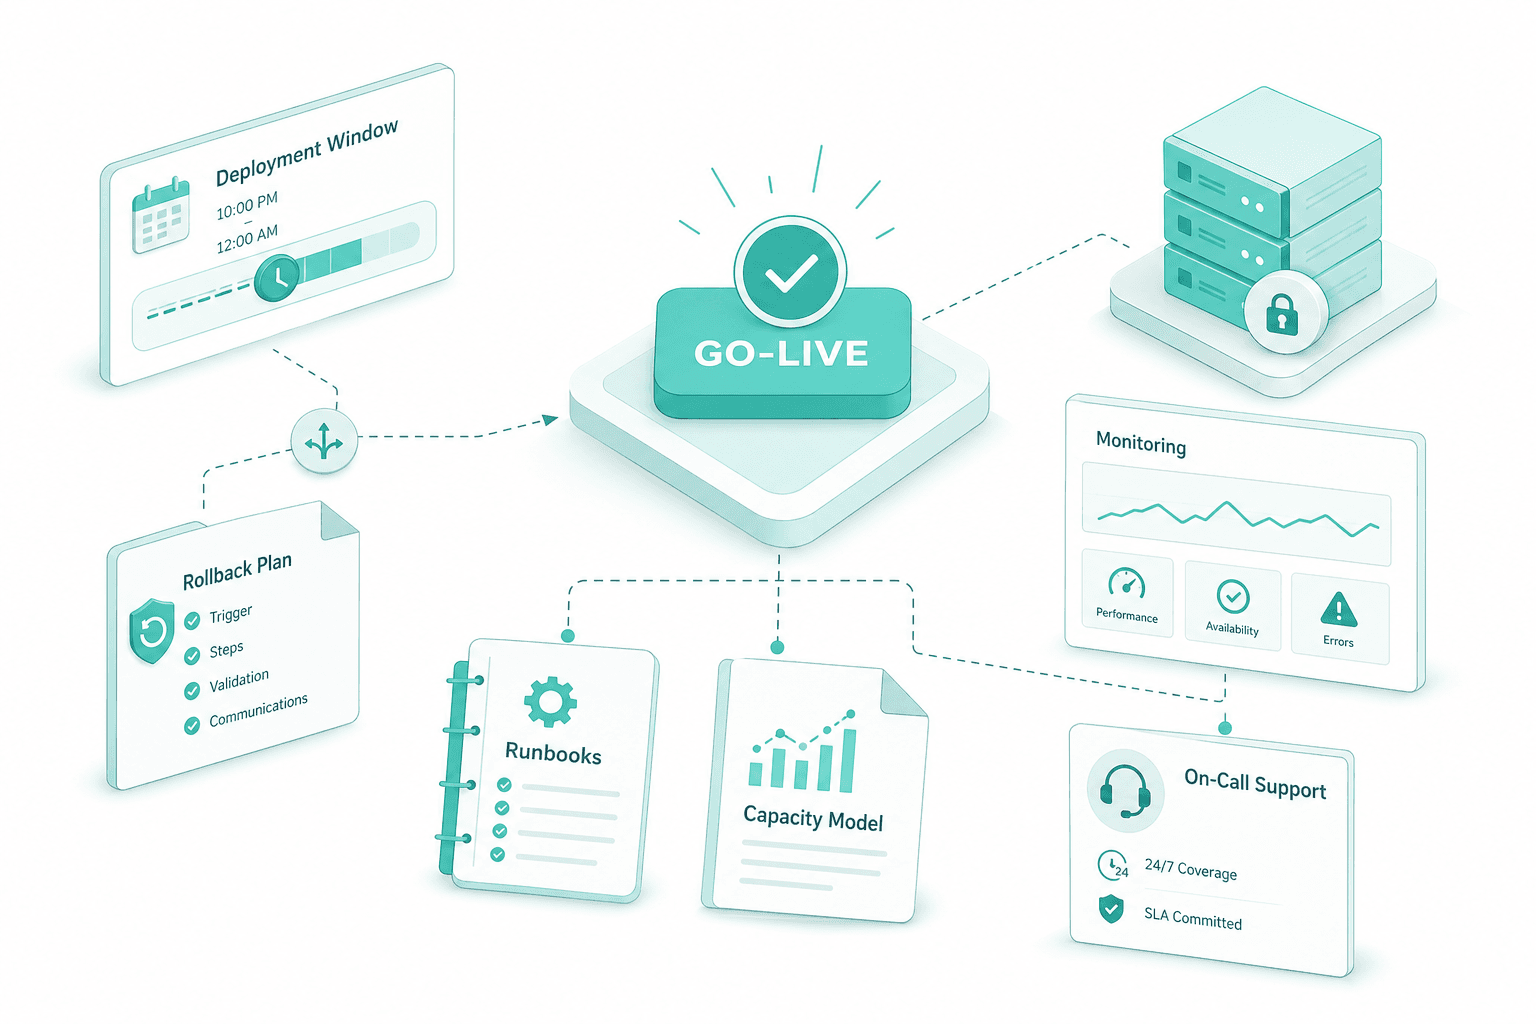
Cutover happens in a defined window with documented rollback. We stay engaged through the first production peak, hand over the runbooks and capacity model, and remain on call under the agreed SLA.
Workload class, expected concurrency, latency budget and regulatory frame — FINMA, cantonal residency, healthcare regulation — are mapped in two to four weeks. The output is the sizing brief that drives every later step.
We size against your real prompt mix and concurrency, not a generic recipe. The plan names GPU class (H100, A100 or L40S range), node topology, network and storage budget, and whether the 8B or 70B variant fits.
vLLM is the default; TGI is picked where the Hugging Face operator surface is already in use; llama.cpp is reserved for edge. The install runs through your image pipeline, your secrets store and your CI, like any other service.
Apertus emits the metrics your stack already speaks. We wire Prometheus scraping, Grafana dashboards and alert rules into your existing observability, with on-call routing through whatever paging system you already use.
We run a representative load test against your acceptance set under expected and stressed concurrency, capture p95 and p99 latency, sustained throughput and failure modes, and sign off jointly with your team.
Cutover happens in a defined window with documented rollback. We stay engaged through the first production peak, hand over the runbooks and capacity model, and remain on call under the agreed SLA.
Why run Apertus on-prem with us
On-prem is the work — the model is the easy part
We install the inference server, size the GPUs against your real prompt mix, wire monitoring into your existing Prometheus, and stay on call through the first production peak. On-prem is the work — the model is the easy part.
Swiss delivery for regulated workloads
The engineering team is in Switzerland and the EU; the deployment lands inside your datacenter or a sovereign Swiss cloud. The frame fits FINMA, cantonal data residency and healthcare regulation by design — we implement under those regimes, we do not sell the certification. For the hosting alternative see Swiss data-sovereignty hosting.
Sized on your prompt mix, not on a model card
GPU sizing is decided in discovery against the prompts your users actually send and the concurrency you actually see. Apertus on-prem deployment clusters live on H100, A100 or L40S class hardware; the 8B and 70B variants get chosen on workload, not on enthusiasm. Hardware stays customer-procured — no GPU reselling on our side.
One platform from POC through RAG to fine-tuning
The same engagement team that runs the production rollout also runs the upstream Apertus evaluation POC and the downstream fine-tuning and RAG integration phases. The platform spine — Laravel, Next.js, PostgreSQL with pgvector, Redis, Mastra orchestration — is the same one used across Apertus Swiss LLM and the broader AI consulting practice.
Frequently Asked Questions
The engagement covers install, GPU sizing against your real prompt mix, inference server setup with vLLM or TGI, monitoring wired into your observability stack, load testing and a production SLA. Discovery and an Apertus evaluation POC run upstream of the rollout.
Sizing is decided in discovery against your real prompt mix, concurrency and latency targets. Apertus on-prem clusters typically use H100, A100 or L40S class silicon; the 8B tolerates smaller and quantized footprints, the 70B lands on heavier hardware.
vLLM is the default for high-throughput server-side inference. TGI fits where the Hugging Face operator surface is already in use. llama.cpp stays reserved for edge or developer laptops, not production. The choice rides on your concurrency and ops profile.
Apertus is wired into your existing Prometheus and Grafana, with alerting routed to on-call. Metrics cover GPU utilisation, queue depth, prompt and completion lengths, request latency and error classes. Your platform team sees inference as any other service.
The SLA is shaped to your workload class — interactive chat, batch enrichment or background RAG — and covers response targets, on-call windows, incident classification and escalation paths. Targets are agreed in discovery against the app's latency budget.
A typical Apertus production deployment runs six to ten weeks from signed engagement to live inference, assuming GPUs are available. An evaluation POC sits upstream; fine-tuning and RAG sit downstream.
About SAPIENTROQ![]()
Interested in a solution?
We are glad to show you various options without any obligation.

Roland Kurmann
CEO, SAPIENTROQ